Model Details

Summary
The InVEST Urban Flood Risk Mitigation Model calculates the runoff reduction, i.e. the amount of runoff retained per pixel compared to the storm volume. For each watershed, it also calculates the potential economic damage by overlaying information on flood extent potential and built infrastructure.
from InVEST Documentation
Data needs
Before running the InVEST Urban Flood Risk Mitigation Model, check the key model input here.
How to run the model?
Model output
Layout
InVEST Urban Flood Risk Mitigation Model outputs have the following layout:
.
│  flood_risk_service.dbf
│  flood_risk_service.prj
│  flood_risk_service.shp
│  flood_risk_service.shx
│  InVEST-natcap.invest.urban_flood_risk_mitigation-log-2023-01-03--19_16_18.txt
│  precipitation=100.txt
│  Q_mm.tif
│  Runoff_retention.tif
│  Runoff_retention_m3.tif
│
├─intermediate_files
│      Q_m3.tif
│      reprojected_aoi.gpkg
│      structures_reprojected.gpkg
│
└─temp_working_dir_not_for_humans
        aligned_lulc.tif
        aligned_lulc.tif.aux.xml
        aligned_soils_hydrological_group.tif
        aligned_soils_hydrological_group.tif.aux.xml
        cn_raster.tif
        s_max.tif
        taskgraph_data.db
Structure rundown
| Folder | File name(s) | Explanation |
|---|---|---|
| ./ | flood_risk_service.*(dbf,prj,shp,shx) | Shapefile with results in the attribute table, e.g.,
|
| ./ | Q_mm.tif | Runoff map (Unit: mm) |
| ./ | Runoff_retention.tif | Runoff retention ratio map (no unit, relative to precipitation volume) |
| ./ | Runoff_retention_m3.tif | Runoff retention volume map (Unit: m3) |
| ./ | *.txt | The txt file lists the parameter values and output messages for that run and will be named according to the service, the date and time |
note
Only key outputs are listed in the above table.
As reflected by its name, files in the /intermediate folder are intermediate output.
If you want to learn more on these output, you can refer to this link.
Results visualization
| Distribution of runoff (Q) (Figure 1) |  |
| Distribution of runoff retention ratio (Figure 2) |  |
| Distribution of runoff retention (Figure 3) |  |
| Distribution of runoff retention service (Figure 4) | 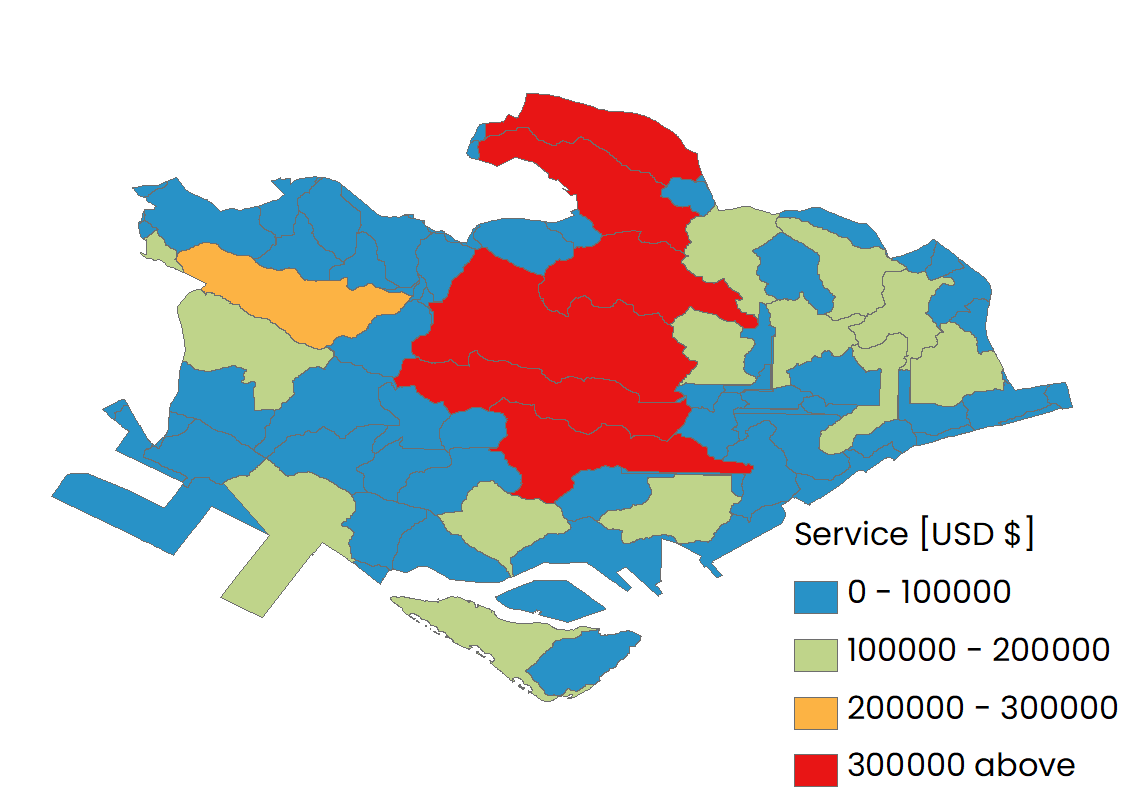 |
| Same as Figure 1, but with land use change |  |
| Same as Figure 2, but with land use change |  |
| Same as Figure 3, but with land use change |  |
| Same as Figure 4, but with land use change | 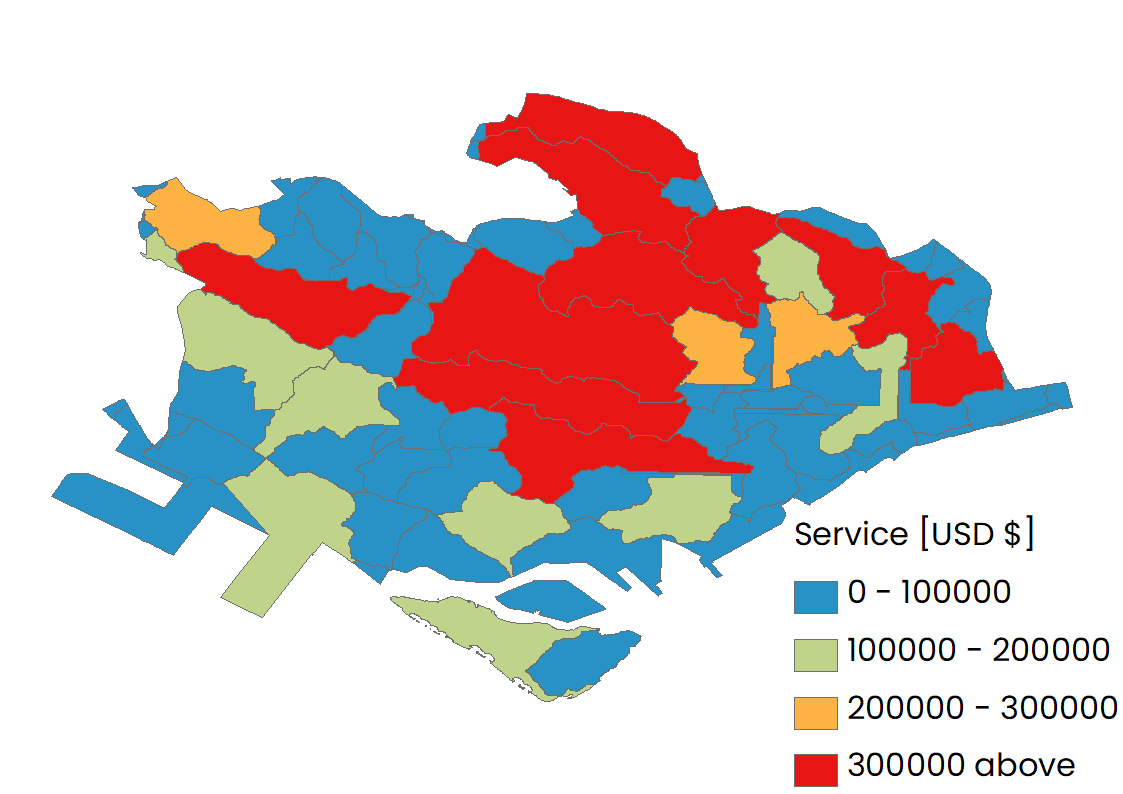 |