Model Details

Summary
Urban heat mitigation (HM) is a priority for many cities that have undergone heat waves in recent years. Vegetation can help reduce the urban heat island (UHI) effect by providing shade, modifying thermal properties of the urban fabric, and increasing cooling through evapotranspiration. This has consequences for the health and wellbeing of citizens through reduced mortality and morbidity, increased comfort and productivity, and the reduced need for air conditioning (A/C).
from InVEST Documentation
The InVEST urban cooling model calculates an index of heat mitigation based on shade, evapotranspiration, and albedo, as well as distance from cooling islands (e.g. parks). The index is used to estimate a temperature reduction by vegetation. Finally, the model estimates the value of the heat mitigation service using two (optional) valuation methods: energy consumption and work productivity.
from InVEST Documentation
Data needs
Before running the InVEST Urban Cooling Model, check the key model input here.
How to run the model?
Model output
Layout
InVEST Urban Cooling model outputs have the following layout:
│  buildings_with_stats.dbf
│  buildings_with_stats.prj
│  buildings_with_stats.shp
│  buildings_with_stats.shx
│  hm.tif
│  InVEST-natcap.invest.urban_cooling_model-log-2023-01-27--21_34_30.txt
│  uhi_results.dbf
│  uhi_results.prj
│  uhi_results.shp
│  uhi_results.shx
│
└─intermediate
    │  albedo.tif
    │  area_kernel.tif
    │  cc.tif
    │  cc_park.tif
    │  cc_ref_aoi_stats.pickle
    │  eti.tif
    │  green_area.tif
    │  green_area_sum.tif
    │  heavy_loss_stats.pickle
    │  heavy_work_loss_percent.tif
    │  kc.tif
    │  light_loss_stats.pickle
    │  light_work_loss_percent.tif
    │  lulc.tif
    │  lulc.tif.aux.xml
    │  ref_eto.tif
    │  ref_eto.tif.aux.xml
    │  reprojected_aoi.dbf
    │  reprojected_aoi.prj
    │  reprojected_aoi.shp
    │  reprojected_aoi.shx
    │  reprojected_buildings.dbf
    │  reprojected_buildings.prj
    │  reprojected_buildings.shp
    │  reprojected_buildings.shx
    │  shade.tif
    │  T_air.tif
    │  t_air_aoi_stats.pickle
    │  T_air_nomix.tif
    │  t_air_stats.pickle
    │  wbgt.tif
    │  wbgt_stats.pickle
    │
    └─_taskgraph_working_dir
            taskgraph_data.db
Structure rundown
| Folder | File name(s) | Explanation |
|---|---|---|
| ./ | buildings_with_stats.*(dbf,prj,shp,shx) | Maps showing various buidling-related statistics, e.g.,
|
| ./ | uhi_results.*(dbf,prj,shp,shx) | A copy of the input vector “Building Footprints” with the following additional fields, including: energy savings and average temperature value |
| ./ | hm.tif | Calculated heat mitigation index (HMI) |
| ./ | *.txt | The txt file lists the parameter values and output messages for that run and will be named according to the service, the date and time |
note
Only key outputs are listed in the above table.
As reflected by its name, files in the /intermediate folder are intermediate output.
If you want to learn more on these output, you can refer to this link.
Results visualization
| Distribution of Wet Bulb Globe Temperature (WBGT) | 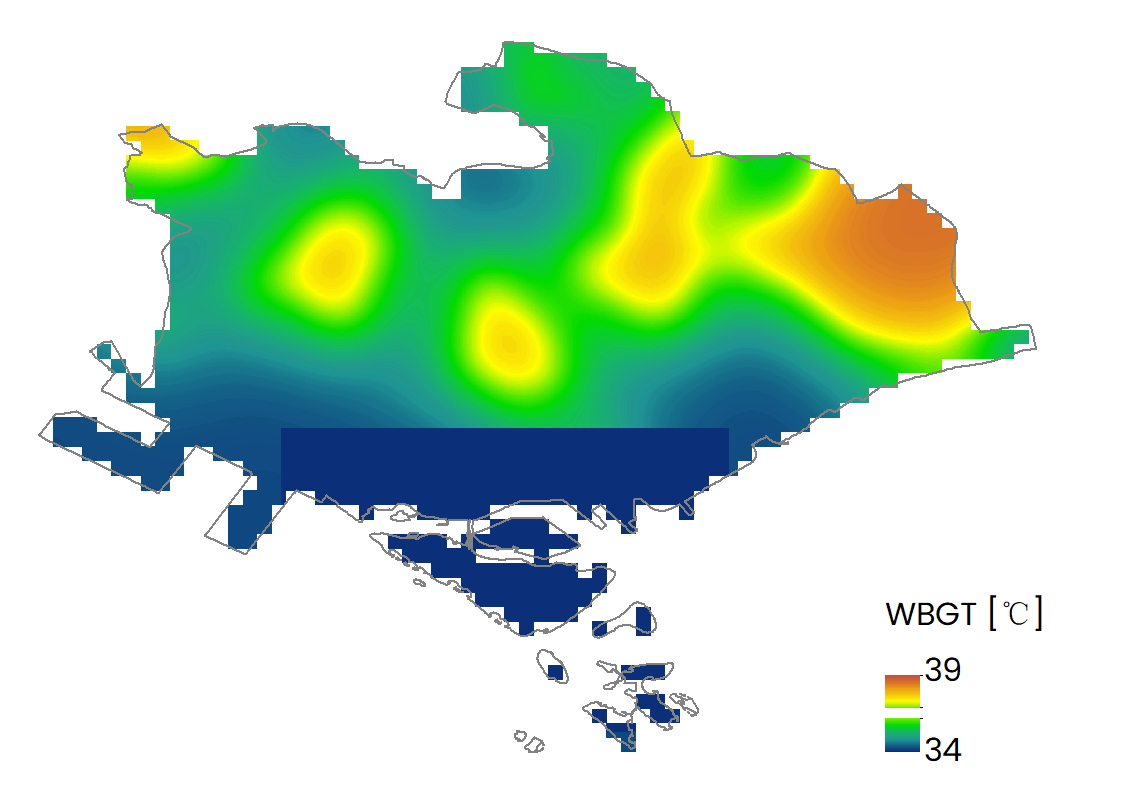 |
| Distribution of air temperature (T_air) | 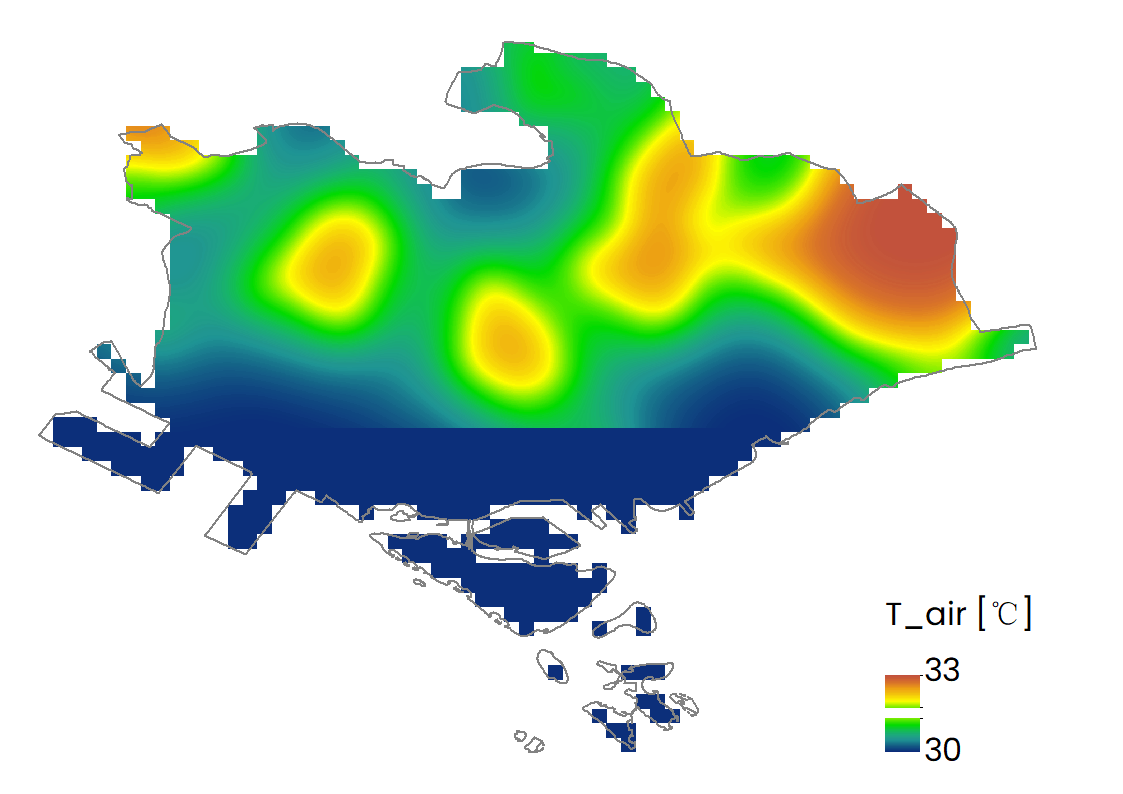 |
| Distribution of albedo |  |
| Distribution of cooling capacity |  |
| Distribution of energy savings | 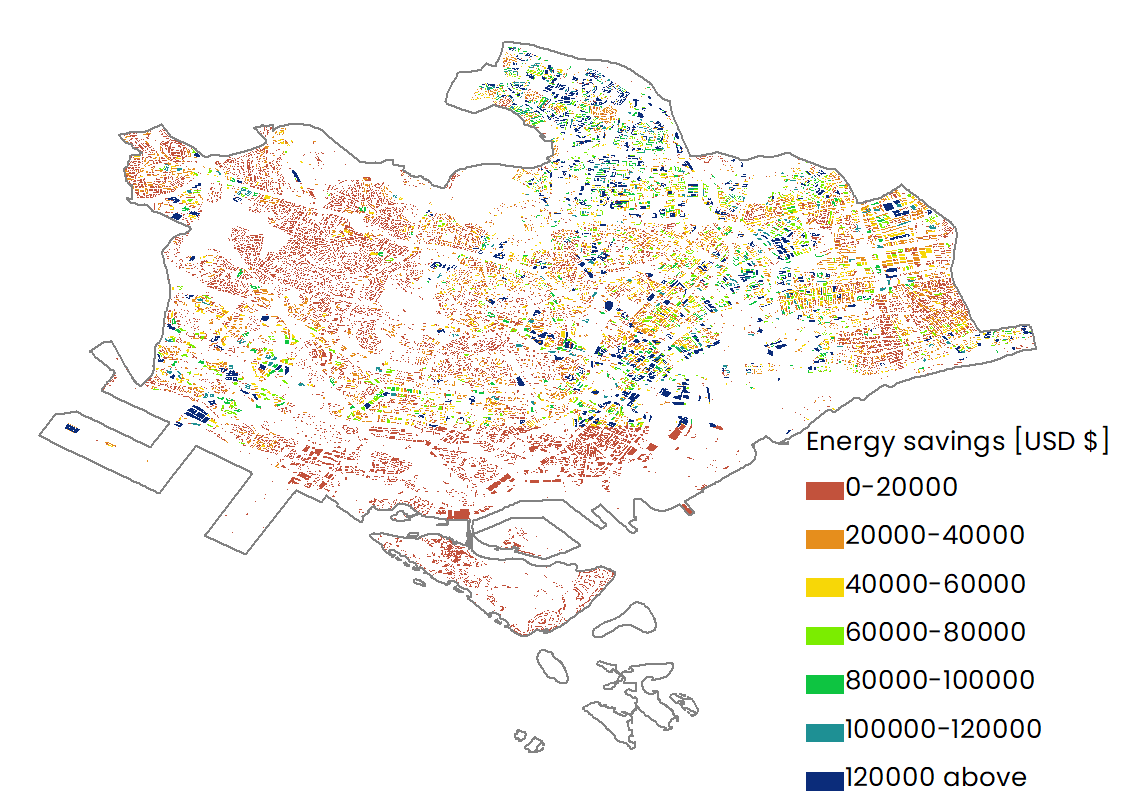 |